


Big Data has been coined the "new oil," which is good news for municipalities, where data abounds. Data, however, until extracted from departmental silos, interconnected and visualized, are not operationally exploitable. Oslo municipality did just that, creating the Oslo Climate Barometer – which we like to call the Smart City Dashboard.
Norway - Ambitious National and Municipal Climate Goals
When Smart Energi CEO, Terese Troy Prebensen, delivered the weather forecast for 2050 earlier this year, we learned that temperatures in Eastern Norway are expected to rise by 1.5 degrees celsius. Although this temperature change is barely noticeable to the human body, we will feel its impacts through a 50 percent increase in rainfall and a 40 and 85 centimeter rise in sea levels.
Fortunately, measures are being taken to slow this process. In April 2016, the Norwegian Minister of Climate and Environment, Vidar Helgesen, put his signature to the Paris Agreement together with representatives from 174 other nations at the UN building in New York City. In cooperation with the EU, Norway has committed to a hairy goal – a 40 percent reduction in greenhouse gas emissions by 2030 compared to 1990 levels.
Several Norwegian municipalities also announced ambitious climate goals. Stavanger municipality intends to reduce emissions by 20 percent by 2020. Oslo municipality is aiming at a 95 percent reduction in greenhouse gases by 2030 and is intent on becoming entirely fossil-free. All municipalities are also required to meet EU directives for air quality, as measured near state highways.
Are These Ambitions Realistic?
It’s encouraging to read about municipalities who are serious about becoming greener. But are their ambitions realistic? I believe so, if they’re adequately equipped. According to my observation, however, this is not the case for most.
A typical Norwegian municipality stores data in various internal systems or silos. Data in each silo is owned by the department that collects them. These departments work independently of each other and rarely involve one another in day-to-day activities.
This kind of silo mentality creates a poor basis for decision-making compared to what can be achieved if they connect the dots between the silos. Unfortunately, silo thinking is a widespread phenomenon in both the public and the private sectors. So, what’s the solution?
We Need to Extract the Data From the Silos
Municipalities need to extract the data from the silos and feed them into a visual interface. Visualizing data makes it possible to see connections between data and discover previously unknown threats and opportunities. Alternative measures can then be easily simulated and impact assessed.
Here are a few examples of new insights that can be derived:
- Is there a connection between air quality and students' concentration and results?
- Is there a connection between the influenza epidemic and greenhouse gas emissions?
- What impact will higher road-toll rates have on reducing greenhouse gas emissions?
Connecting the dots as we have described here gives municipalities a solid basis for making decisions, initiating measures for the best short and long-term results, and helping to ensure they reach their climate goals. This requires, however, that you invest in a software platform without blind alleys: a platform that gives you access to all data sources, enabling you to report on them, visualize them, analyze them and apply them to machine learning or the development of artificial intelligence.
Oslo Municipality Climate Barometer (The Smart City Dashboard)
The municipality of Oslo committed to an ambitious target of reducing greenhouse gas emissions by 95% by 2020. To determine the right measures to achieve this goal, Oslo needed an overview of the city’s traffic patterns divided by pedestrian, cyclist and car counts. They also wanted an overview of climate indicators (KPIs) like EV charging capacity and utilization, as well as the distribution between EVs, fossil fueled cars and heavy transport.
Oslo invited solution providers to a competition, which eSmart Systems won. Together with my colleagues in eSmart Systems, I had the pleasure of working with Oslo municipality to create a climate barometer prototype for them. We successfully connected the municipality's diverse data sources to the platform and visualized them in a web-based dashboard. The screenshot below shows a similar solution:
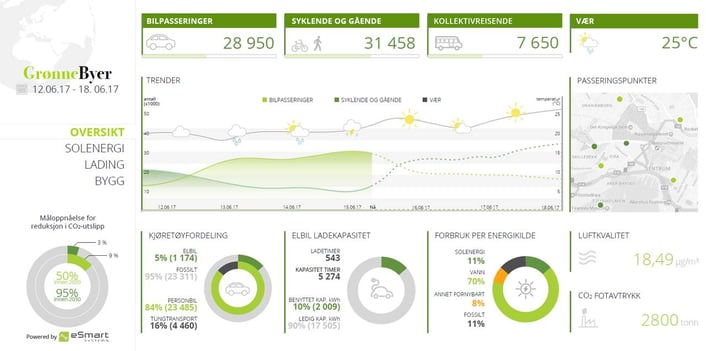
Users can toggle between screens and quickly get situational snapshots. Predictions of next- day traffic patterns are visualized in a graph based on historic traffic data and weather forecast data. Toll passes and EV charging stations are visualized in a map, giving useful input about bottlenecks and usage patterns. We also integrated Twitter to show realtime citizen tweets related to the municipality.
Once the data was visualized and applied across municipal departments, they took on an entirely different, higher utility value and spawned new ideas. The Oslo Climate Barometer was developed with limited resources in a short time and shows what is possible with the right platform and smooth cooperation.


.png?width=250&height=64&name=Grid%20Vision%20logo(250%20x%2064%20px).png "Grid Vision logo(250 x 64 px)")